
How Strong Will You Get?
How Strong Will You Get?
Realistic expectations for the serious but non-competitive lifter

This is one of the most frequent yet frustrating issues that comes up for both coaches and lifters. People want to have numbers for each lift to chase, as motivation, but those numbers might be based on entirely unrealistic expectations of things they see at the gym or on social media. Many charts and standards have been created to try to capture this data and bring some clarity to this issue, a whole host of which are referenced or summarized here. Some are more useful than others, but all the ones I’ve seen suffer from the same core problem: They don’t take into account genetic potential of the lifter.
The Problem: Genetic Potential
As of now and probably for at least the medium term future, there is no genetic or scientific test you can take to determine your genetic potential. There’s literally no way to know exactly, down to the pound or kilogram, what your maximum potential on each lift is. But because we aren’t post-modernists who don’t believe reality exists, and we don’t engage in endless heap fallacies and univariate fallacies, we also don’t therefore conclude that genetic potential isn’t real or a useful concept. In fact, it has tons of explanatory power, and anyone who has coached for a while has clearly seen it in action. Some people respond really well and easily to training, becoming stronger and more muscular. Others get the same dose of training, the same program, and their progress stalls sooner and goes much slower. Some of this can explained by nutritional and other recovery compliance, but clearly there is a large genetic component. Just like some people are naturally better at basketball or playing the violin. Big fat DUH.
Like anything else in physiology, there’s some grey areas at the margins, but we can usually tell within a few weeks, or months at most, if someone is lower, average, or higher on the genetic potential scale for training. Sometimes we can even tell the very first session.
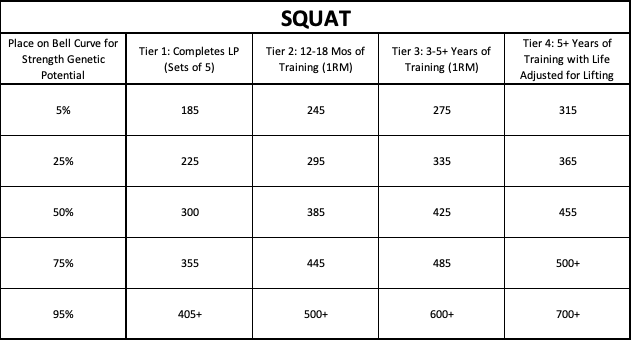
So when strength standards charts say that you should be able to squat 2x your bodyweight, or 455 lbs, to be considered strong or elite or whatever, this leaves out the question of whether that’s even realistic at all for this person who is on the left side of the curve, or if it’s an absurdly easy goal for the guy on the right side of the curve who should be setting his sights on 700 or a 3x bodyweight squat.
A Different Kind of Strength Standards Chart
I thought of a solution to this longstanding issue when I saw my old colleague Paul Horn’s new book, Radically Simple Strength. Paul has some charts in there that attempt to super-simplify these numbers for the broad general population. And I think his charts are very good for that purpose.
I have the same goal in mind, but for a slightly more tailored audience: coaches and lifters who have already been in the game for a little while and want some realistic numbers to chase, but are not competitive powerlifters per se.
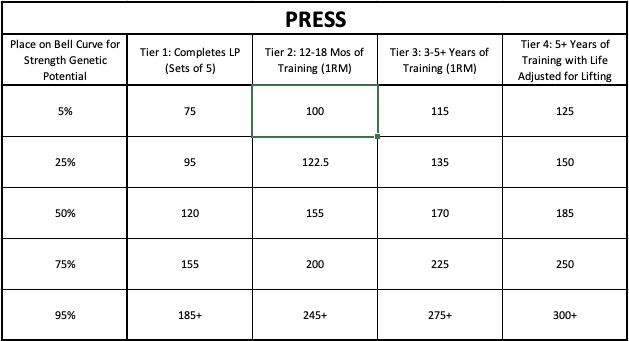
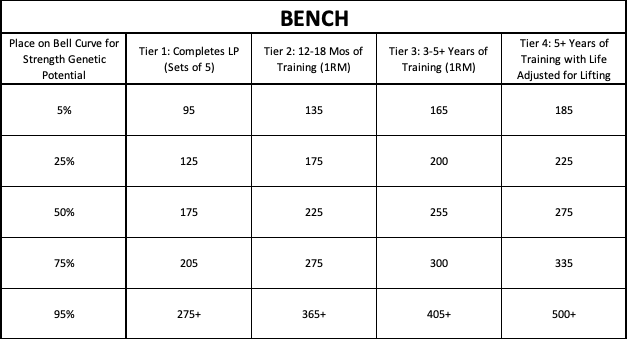
So instead of basing my charts on bodyweight and lifting categories like novice/intermediate/advanced or Class 1/Class 2, etc…mine are based on genetic potential and how long you’ve been training.
Since charts only have 2 axes, I have to assume “healthy male of roughly normal size, between about 20-40.” This is a big assumption around which a lot of variation can exist, but don’t blame me for the limitations of 2D charts. I’ve coached a lot more males than females, and there are a lot more males than females who strength train seriously, but I may make a female version of this in the future, too.
Despite the limitations, I’ve found this to be a very handy set of charts to help guide coaches and lifters as to what’s realistic, and it’s not that hard to make mental adjustments for being older or bigger/smaller. Just a little common sense.
I also want to note that I made these charts based off my estimates of having coached thousands of people, having gone to gyms for 20 years watching thousands more lift and talking to many of them, and having hundreds of friends and acquaintances who are lifters of various stripes. It’s not based on formal data. However I generally do not trust such data anyway, because it typically does not do a good job of standardizing for things like squat depth/full ROM on all lifts, along with self reporting issues in general. I do, however, trust what I’ve seen with my own eyes over 20 years.
Finally, many people who don’t necessarily start out planning to compete, eventually do so once they realize (even implicitly) that they’re towards the right side of the curve. Most people at or near the 95% mark on these charts will have competed at some point, maybe as a hobby or maybe more seriously, but usually it happens at some point.
I posted this on my Instagram a few months ago, and made a few very small changes here upon further reflection. Based on the previous caveats, small changes like this are to be expected as they reflect the inherent judgement calls about exactly what the slope of the genetic bell curve looks like, and roughly where the points I use represent on that curve.
They should be taken solely as estimates, not exact numbers, and representative of rough placeholders on the genetic potential curve, not exact plot points.
What You’ve All Been Waiting For: The Charts
So without further adieu, the charts are below. Would love feedback from you readers on what you think. Do you find them helpful? Accurate? Let me know down below in the comments.
SQUAT
BENCH
DEADLIFT

PRESS